My brother came to me in Autumn 2020 with a view he wanted to do something for Movember - in particular he had in mind a 60 km cumulative running distance challenge. The idea was asking friends and family to sponsor each of the 60km, and myself, brother, and dad would then commit to run all of them (each!) over November.
Considering the charity element was asking friends and family to sponsor a specific kilometre, I thought a way to track the progress would be really motivating - plus I really enjoy anything involving the displaying of data.
The output is live here.
Tracking Kilometres
All of us use Strava, and a number of times I'd had a play with the API so wasn't coming at it completely fresh - I knew what it was capable of. The Movember website already offered some integration, but it didn't quite go as far as I wanted.
At first I thought I'd simply store a local sum of kilometres run per person, that would increment every time a run was uploaded to Strava. However, I wanted to track when each person completed a specific kilometre, and also a timeline of when kilometres were completed which would be displayed - as a timeline - on the page, so this required a bit more under the hood logic.
Old and New
Obvious technology for the platform was Flask running on PythonAnywhere. It was something I was familiar in - and allowed building off the structure and frontend I'd picked up in my run prediction tools.
The two biggest new challenges were firstly interaction with the Strava API, and as this required keys authorised by the Strava accounts - and secondly user authentication to setup this interaction. I found the Strava integration straightforward, especially using a python library for this purpose - debugging was challenging as I had to make the requests 'live'. Authentication was achieved using Flask-Login which I really enjoyed using - it was intuitive, clean and secure.
My brother was tracking the sponsors using a spreadsheet - with some people joining after the month had started. The CSV of the spreadsheet was the data for the kilometre info, and I provided an upload form so he could update whenever there was a change.
Visualisation
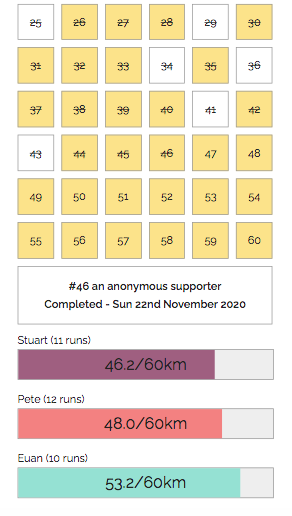
I viewed the primary output of the project being data visualisation, and therefore the theme was simplicity and function. Once again I used skeleton.css as a basis for the frontend with some custom components (and much time on stackoverflow working on centring) for the kilometre boxes. There was also some pure javascript added to allow each box to be clickable and provide detail on who had sponsored it.
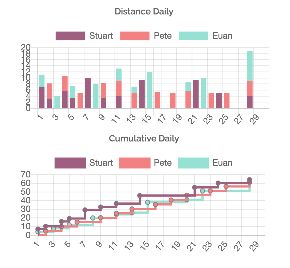
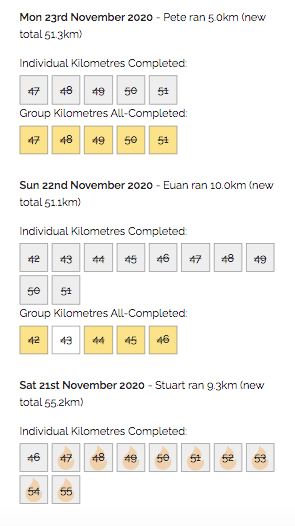
Below the kilometre tracking was a chronological timeline, which showed what runs ticked off what kilometres individually and as a group (this requiring some notion of chronology being kept in the data storage, rather than just a summing counter as described earlier). As a late addition I added some graphs for the progress. The entire page operated in a columnated fashion such that on mobile devices it still rendered sensibly.
Output
The live version lived on PythonAnywhere and was mostly finished by the start of the month (minus the graphs) so that we could follow progress. A better solution to the API which I played about with after was use of hooks so that Stava could notify the application of an update, rather than an hourly polling for changes which was costing me CPU cycles.
Once the month was complete there was no value in the live version anymore - so I had a go at 'freezing' the Flask to make the tracking page completely static. This worked really well for this scenario - and I uploaded the static site to netlify to share with sponsors on our charity page.
Top ^